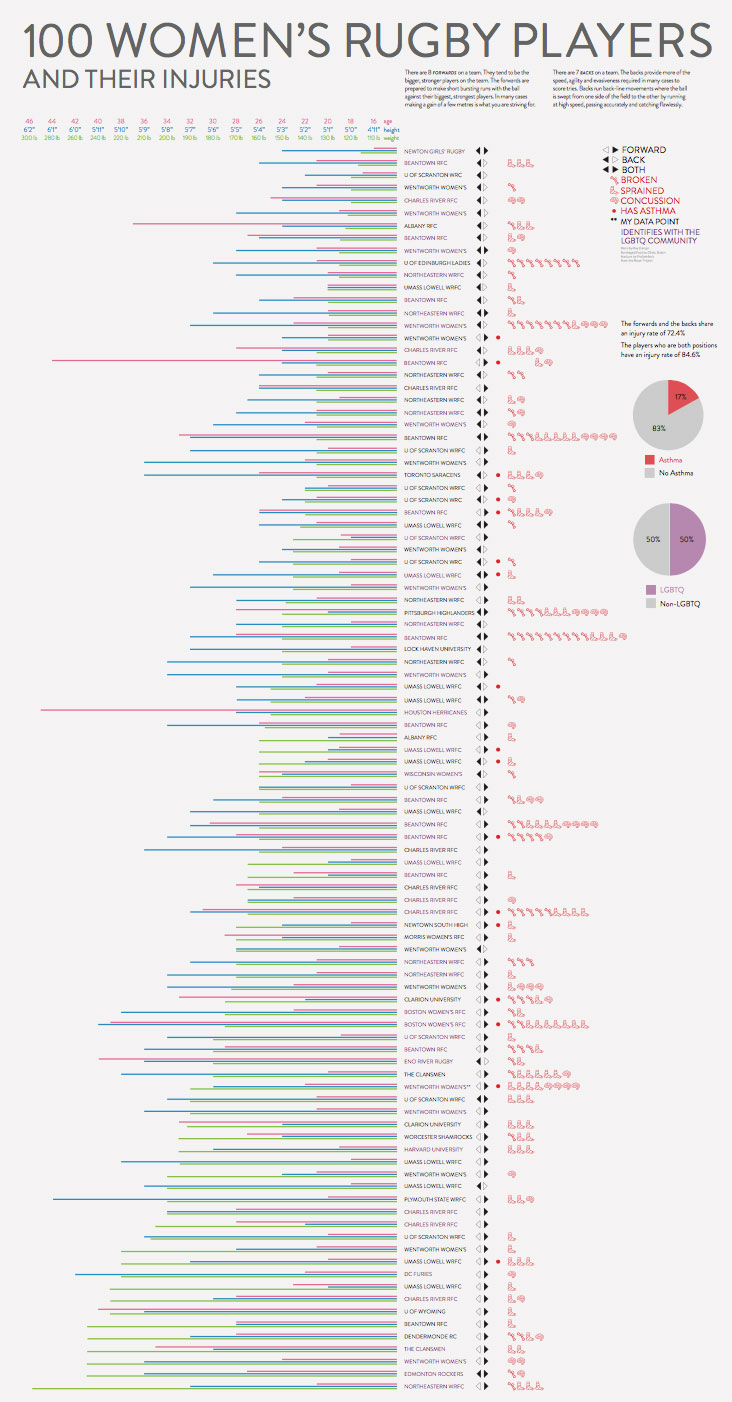
1 2 3 4

100 Things.

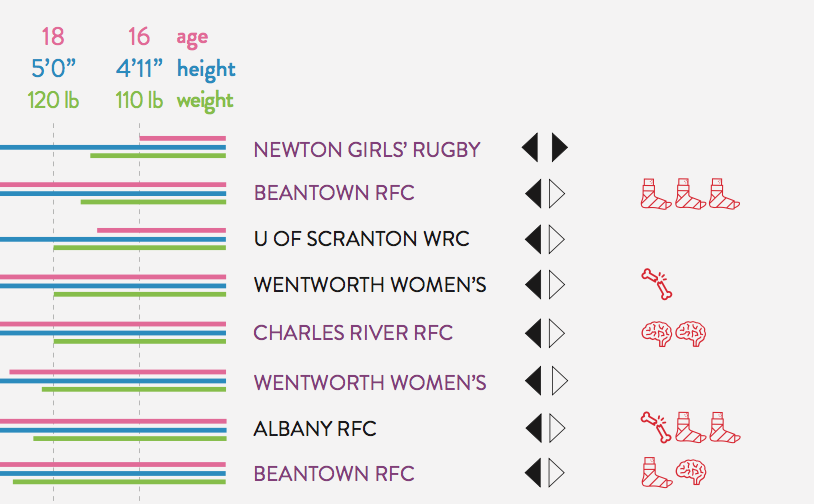
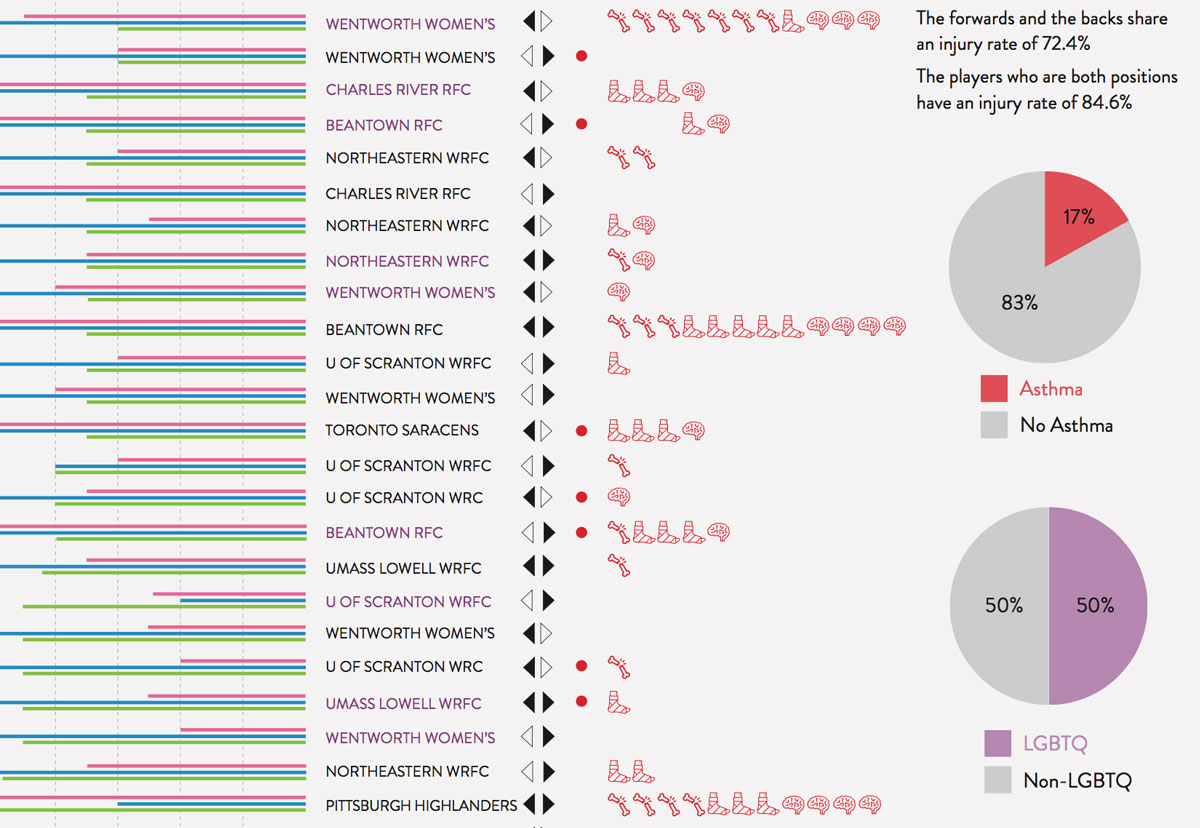
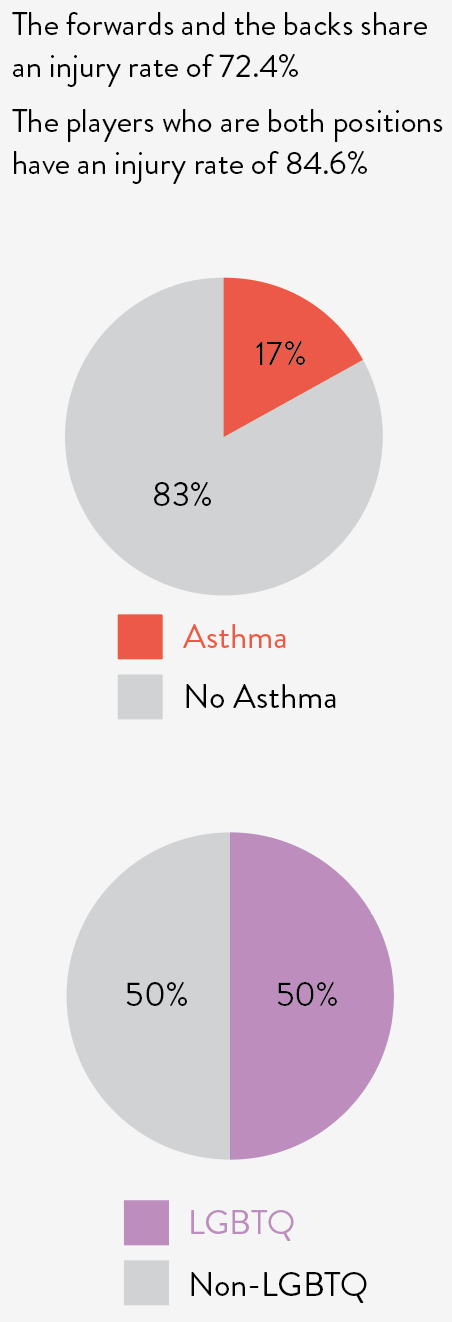
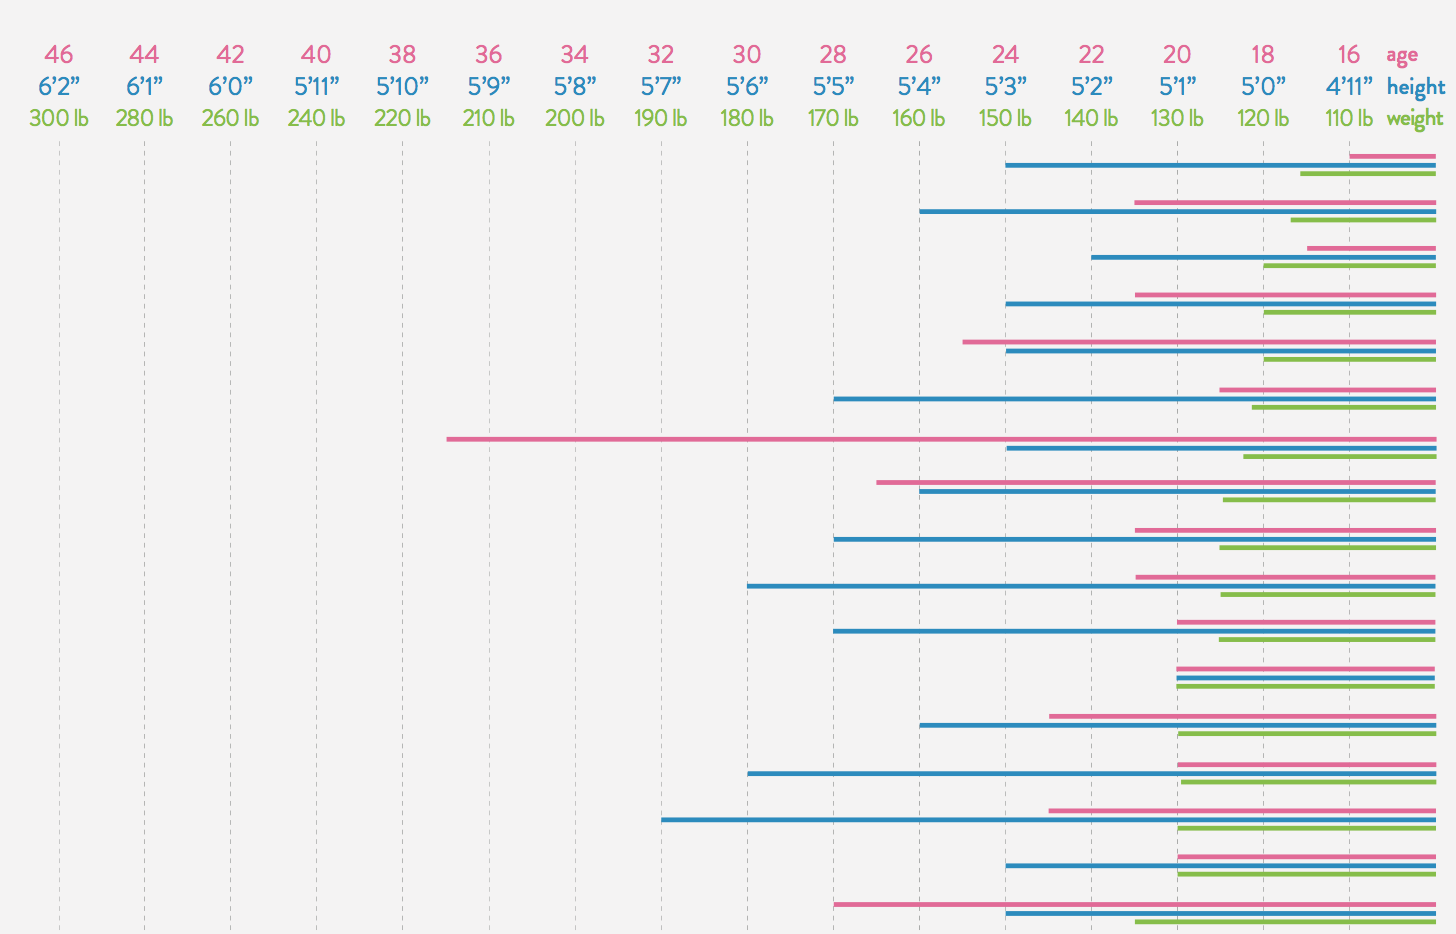
This project was focussed upon crating a visual representation of one hundred things or people. Each data point was required to have at least seven addition points of information to include. The objective was to create a poster and design that was dynamic as well as hierarchly correct.

Click on each image to see a full view.

100 overview
Here's a full view of the final project.
100 key
The key that was used was comprised of simplistic images, shapes and colors.
100 forwards and backs descriptors
Descriptions of the rugby positions: forwards and backs.
100 screenshot of top full size
A small, zoomed in view of the top of the poster.
100 tinier overview
Looking at the player stats and what details are found on each player.
100 that square including charts
A bigger look at how each element works together in a system.
100 pie charts
A zoom of the pullout information; the pie charts.
100 the bar graph part
A more detailed look of the bar graph.